Not sure who this is but it’s one of them:
Getting closer to useful. Need to work on the housing.
Some static setups:
[nggallery id=98]
The LEGO Ball Machine:
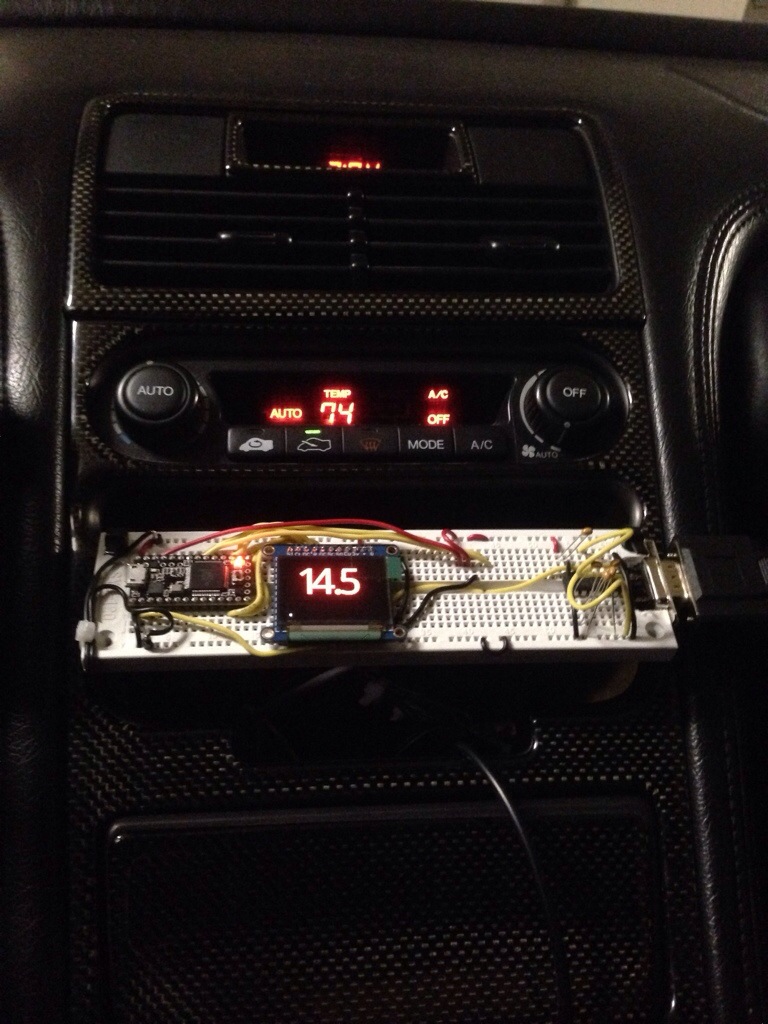
This is a display I’m working on to replace the clock in the NSX. It will show various parameters from the data-logging system I have, the Zeitronix ZT-2. In this video, the display is configured as follows:
From the bottom to the top,
All the color-changing, moving elements are pretty confusing, and the display is very small. I need to think about the best information to display and the best way to display it. But this is a test setup to try out a few things. Figuring out the best way to draw bar graphs, changing colors, and even the numeric values took some time. There are still a couple of weird issues with reading the data consistently, as you can see in a flash of the display where MAP has a problem (at 0:12 in the video).
I don’t think there is any need for MAP unless under boost, so the numeric display for that can go away. TPS is similar: it’s not really something I want displayed. I will probably change the tachometer to only show up from 7,000-8,000 rpm, as a shift light. Otherwise, I have no need. So that leaves AFR and the boost gauge. I may do AFR with a bar graph too, as reading numbers isn’t all that useful. I do have a separate, very bright 4-digit alphanumeric display that I am considering adding, which could display AFR only when under boost, for example. I also have to think about how to mount the OLED in a way so that it’s shadowed from the sun, as that will be required for readability. Fun project though.
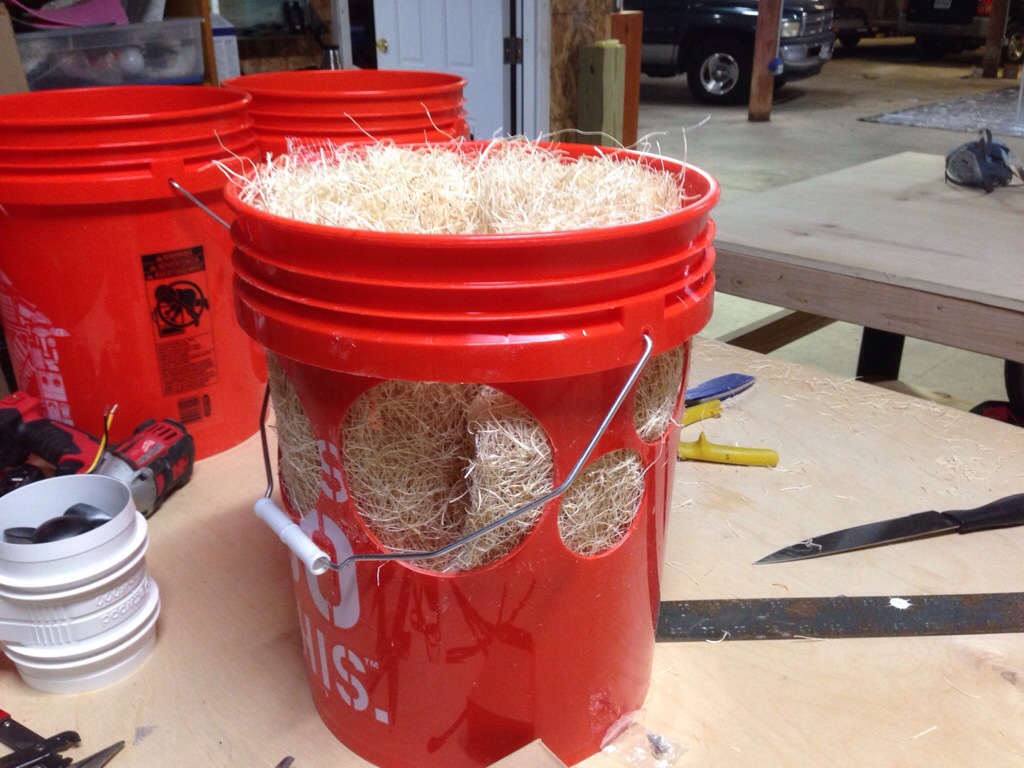
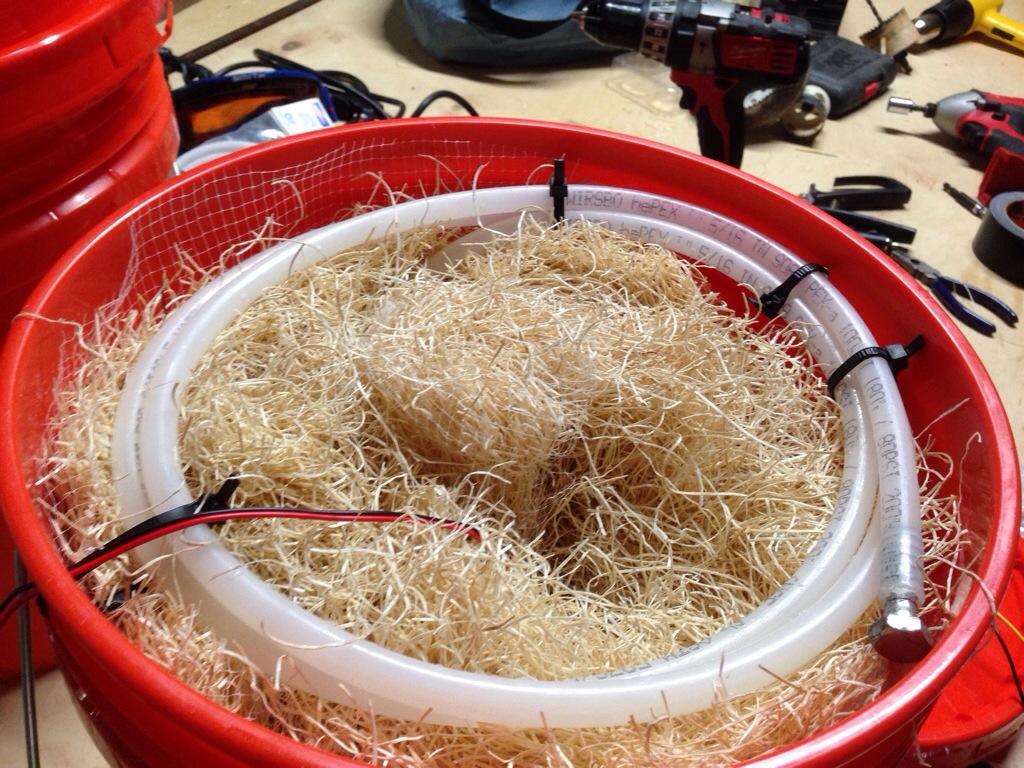
Evaporative cooler a.k.a. swamp cooler:
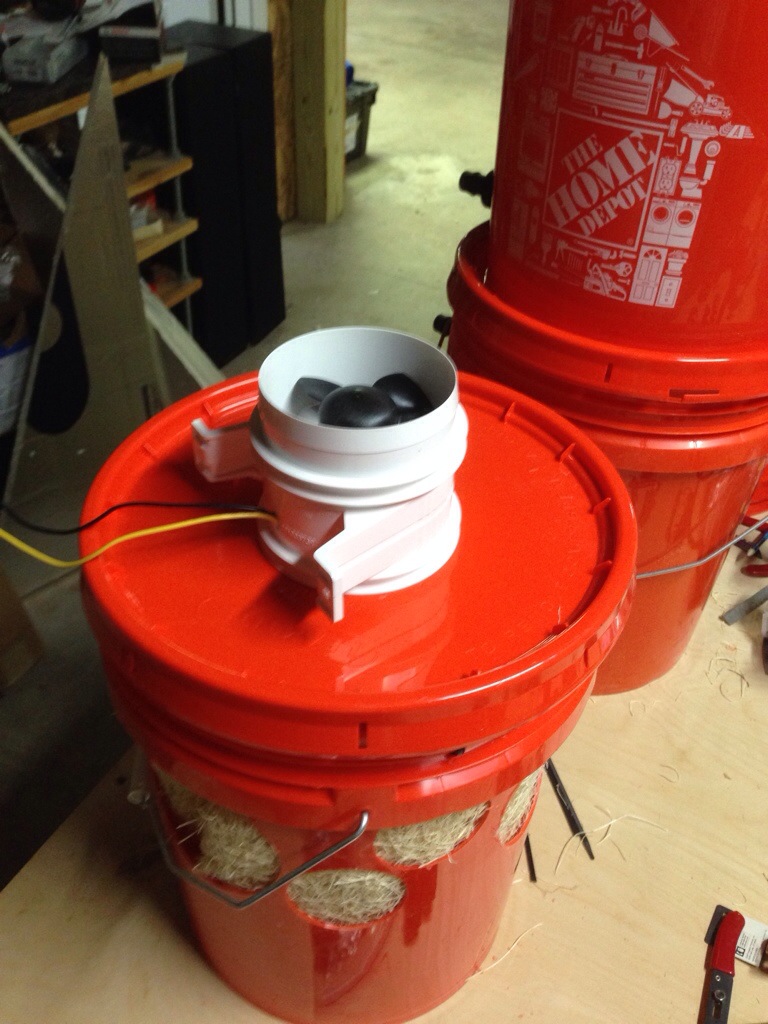
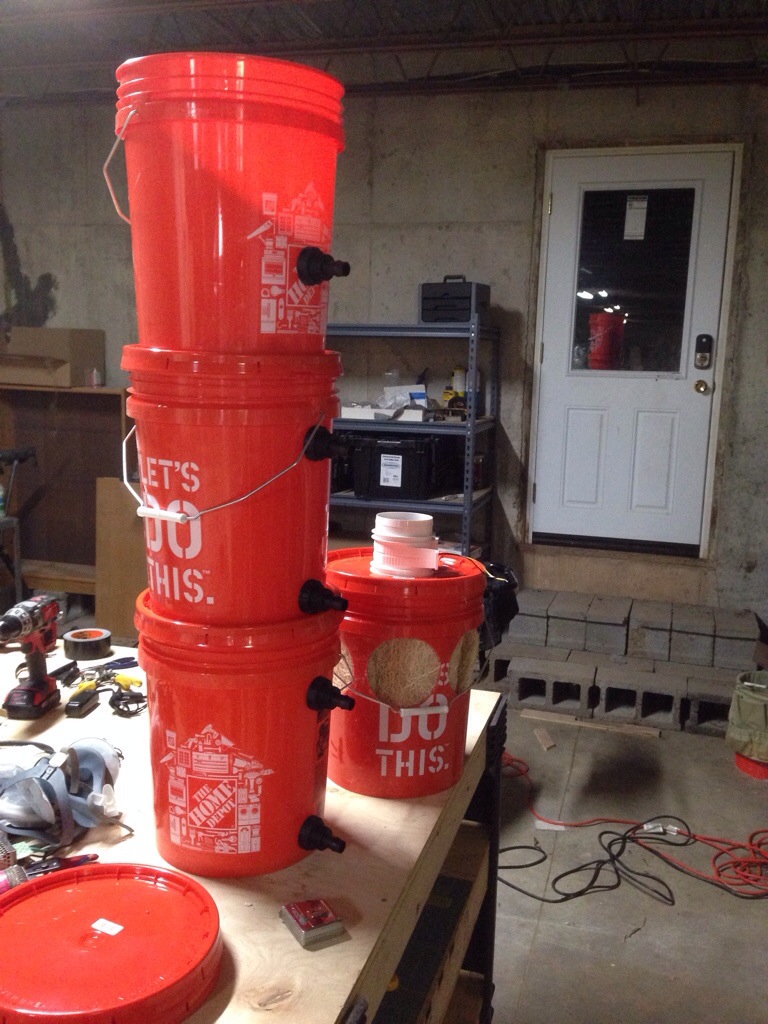
Bucket cascade for treating gray water; the top is for flocculation and settlement, then a valve will allow flow to the bottom two, which will be sand filters and chemical sanitation:
It’s getting there. We will fold the bottom part to a flat package and the top part to a mostly flat package. The two will be assembled on the playa.